Today’s smoke outlook

70–110 AQI

Moderate to Unhealthy for Sensitive Groups

Typical regional AQI · Today

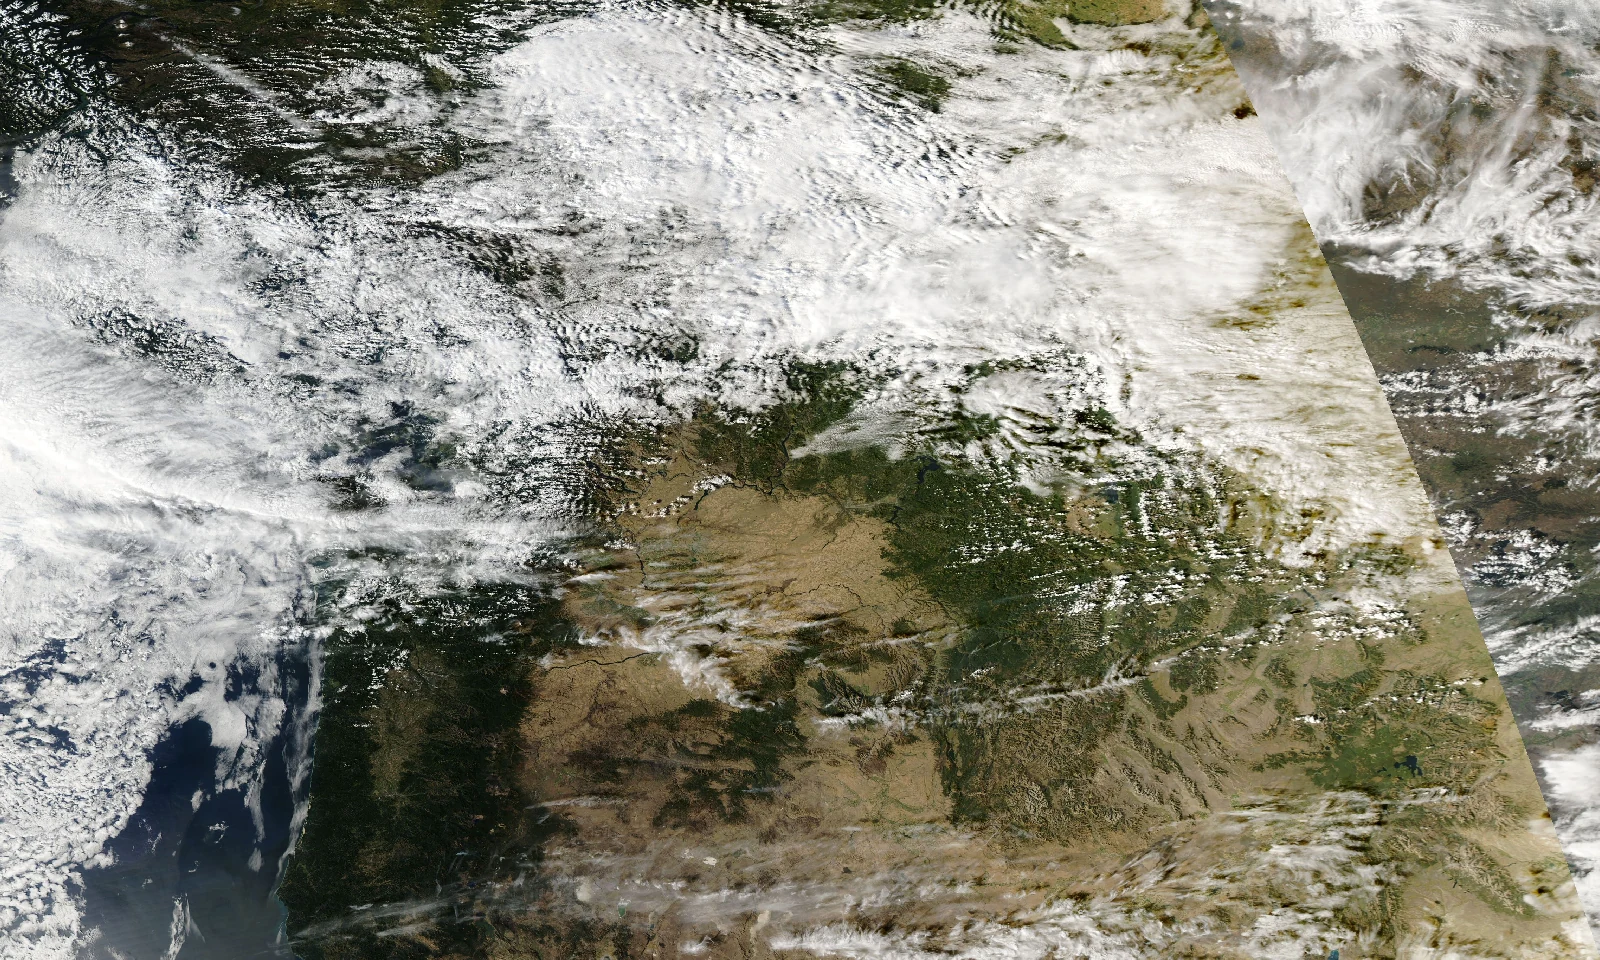
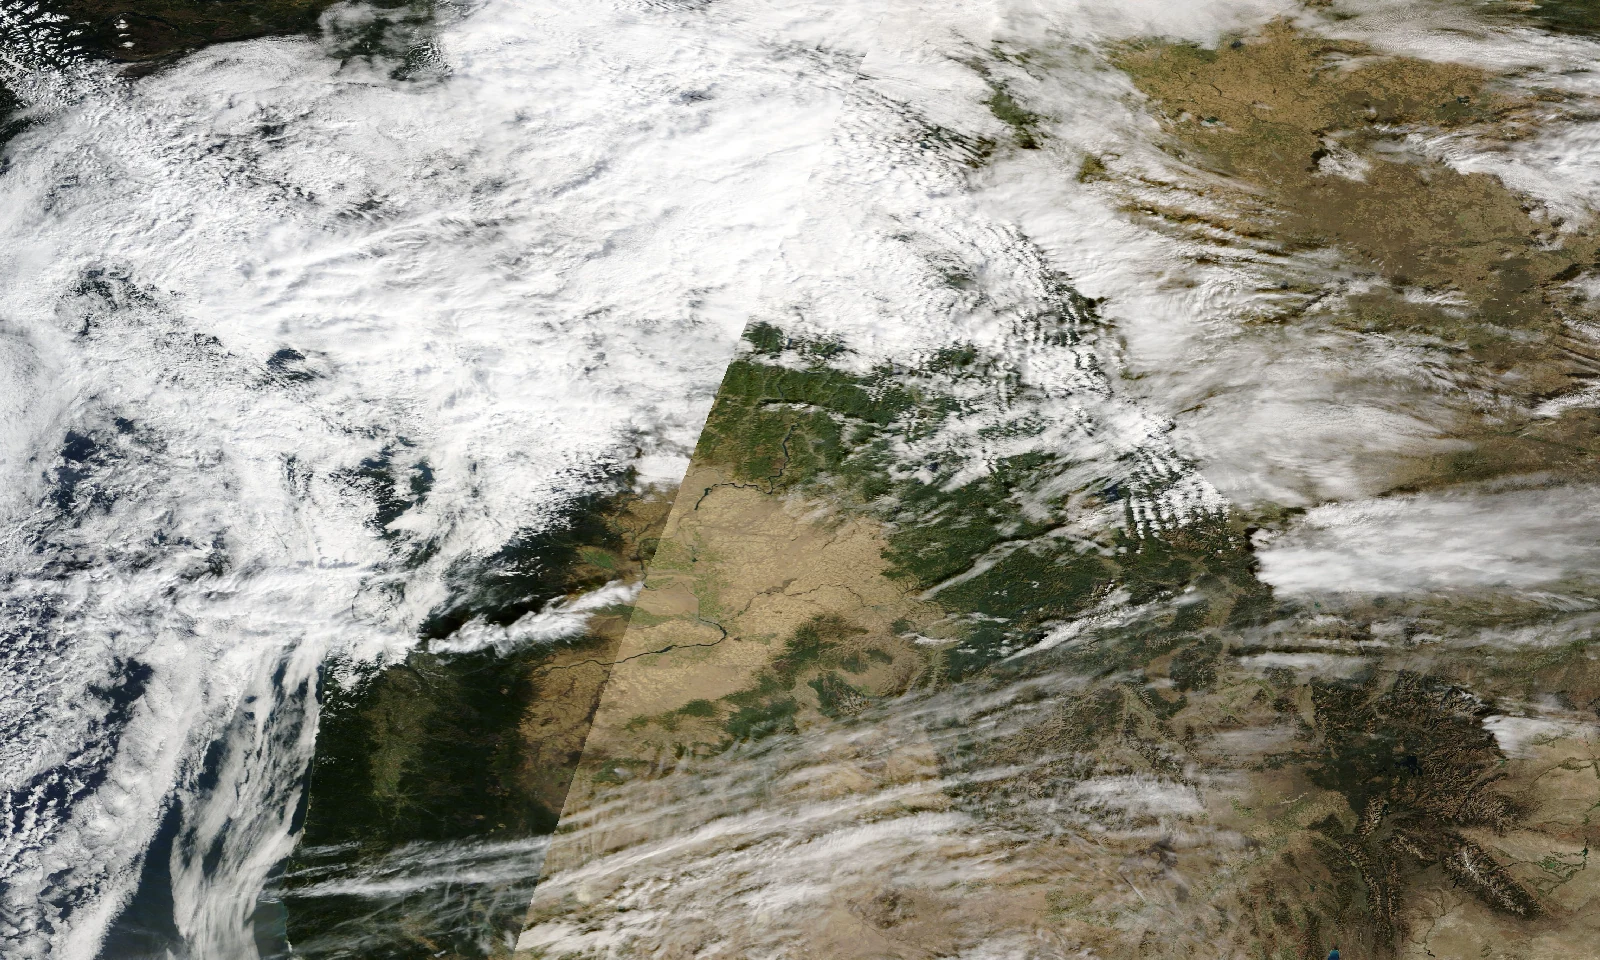
Surface smoke likelihood is high and elevated smoke likelihood is high; the most likely AQI range is 90-155. Satellite analysis detected visible smoke over or near the region. Community sensors show a northeast to southwest gradient.

Tomorrow

100–150 AQITypical regional AQI

Cleaner: Silver Valley 50–135 · Smokier: Deer Park 215–220

Later

145–150 AQITypical regional AQI

Cleaner: Colville 125–130 · Smokier: Deer Park 215–220

Localized conditions vary from the typical range

  • Deer Park area120–220
  • Colville area40–130
  • Newport–Cusick65–110
  • Metaline Falls area55–65
  • Spokane metro125–205
  • Coeur d’Alene corridor100–175
  • Rockford area90–185
  • North Idaho / Northwest Montana65–95
  • Silver Valley65–85

Representative location forecasts; localized exceptions are shown separately from the full regional envelope.

Peak risk
Thursday Midday
Surface smoke
High likelihood
Primary direction
W → E
Forecast horizon
Next 48 hours

Upcoming periods

TUESDAY, AUGUST 4

Midday

Varies by area · typical AQI

  • Deer Park140–145
  • Colville55–60
  • Newport–Cusick70–75
  • Metaline Falls55–60
  • Spokane metro125–130
  • CdA corridor100–105
  • Rockford110–115
  • North ID / NW MT70–70
  • Silver Valley80–85
Regional envelope: Unavailable (full member range)

Unavailable

Unavailable mixing

Surface Unavailable Likelihood of smoke affecting near-ground air during this period. Aloft Unavailable Likelihood of elevated smoke overhead; this does not by itself indicate surface AQI impact.

Late Day

Varies by area · typical AQI

  • Deer Park120–155variable
  • Colville59 ↘ 47
  • Newport–Cusick72 ↗ 84
  • Metaline Falls55–65
  • Spokane metro129 ↗ 202
  • CdA corridor100–160variable
  • Rockford111 ↗ 183
  • North ID / NW MT65–95variable
  • Silver Valley65–85variable
Regional envelope: 75-200 (full member range)

NW→SE · 5 mph · Light

Deep mixing

Surface Moderate Likelihood of smoke affecting near-ground air during this period. Aloft Moderate Likelihood of elevated smoke overhead; this does not by itself indicate surface AQI impact.

Evening / Overnight

Varies by area · typical AQI

  • Deer Park148 ↗ 216
  • Colville45 ↗ 126
  • Newport–Cusick65–150variable
  • Metaline Falls59 ↗ 115
  • Spokane metro195–200
  • CdA corridor170–175
  • Rockford175–185
  • North ID / NW MT75–95variable
  • Silver Valley65–80variable
Regional envelope: 75-230 (full member range)

Variable · 3 mph

Shallow mixing

Surface High Likelihood of smoke affecting near-ground air during this period. Aloft Moderate Likelihood of elevated smoke overhead; this does not by itself indicate surface AQI impact.

WEDNESDAY, AUGUST 5

Morning

Varies by area · typical AQI

  • Deer Park215–220
  • Colville125–130
  • Newport–Cusick146 ↘ 126
  • Metaline Falls115–130
  • Spokane metro190–200
  • CdA corridor170–175
  • Rockford183 ↘ 142
  • North ID / NW MT75–85
  • Silver Valley55–65
Regional envelope: 95-230 (full member range)

Calm · 2 mph

Shallow mixing

Surface High Likelihood of smoke affecting near-ground air during this period. Aloft High Likelihood of elevated smoke overhead; this does not by itself indicate surface AQI impact.

Midday

Varies by area · typical AQI

  • Deer Park215–220
  • Colville125–130
  • Newport–Cusick121 ↗ 146
  • Metaline Falls125–130
  • Spokane metro185–200
  • CdA corridor170–175
  • Rockford145–175variable
  • Sandpoint100–145variable
  • Bonners Ferry78 ↗ 140
  • Libby78 ↗ 153
  • Silver Valley50–60
Regional envelope: 100-230 (full member range)

W→E · 2 mph · Light

Moderate mixing

Surface High Likelihood of smoke affecting near-ground air during this period. Aloft High Likelihood of elevated smoke overhead; this does not by itself indicate surface AQI impact.

Late Day

Varies by area · typical AQI

  • Deer Park215–220
  • Colville125–130
  • Newport–Cusick145–150
  • Metaline Falls125–130
  • Spokane metro179 ↗ 196
  • CdA corridor170–175
  • Rockford140–160variable
  • North ID / NW MT140–145
  • Kellogg73 ↗ 124
  • Mullan55 ↗ 73
Regional envelope: 120-230 (full member range)

W→E · 5 mph · Light

Deep mixing

Surface High Likelihood of smoke affecting near-ground air during this period. Aloft High Likelihood of elevated smoke overhead; this does not by itself indicate surface AQI impact.

Evening / Overnight

Varies by area · typical AQI

  • Deer Park215–220
  • Colville125–130
  • Newport–Cusick145–150
  • Metaline Falls125–130
  • Spokane metro195–200
  • CdA corridor170–175
  • Rockford150–185variable
  • North ID / NW MT140–145
  • Kellogg140–155
  • Mullan75–135variable
Regional envelope: 165-230 (full member range)

SW→NE · 3 mph · Light

Shallow mixing

Surface High Likelihood of smoke affecting near-ground air during this period. Aloft High Likelihood of elevated smoke overhead; this does not by itself indicate surface AQI impact.

THURSDAY, AUGUST 6

Morning

Varies by area · typical AQI

  • Deer Park215–220
  • Colville125–130
  • Newport–Cusick145–150
  • Metaline Falls125–130
  • Spokane metro196 ↘ 184
  • CdA corridor170–175
  • Rockford160–175
  • North ID / NW MT140–145
  • Silver Valley130–145
Regional envelope: 160-230 (full member range)

S→N · 3 mph · Light

Shallow mixing

Surface High Likelihood of smoke affecting near-ground air during this period. Aloft High Likelihood of elevated smoke overhead; this does not by itself indicate surface AQI impact.

Midday

Varies by area · typical AQI

  • Deer Park215–220
  • Colville125–130
  • Newport–Cusick145–150
  • Metaline Falls125–130
  • Spokane metro180–185
  • CdA corridor170–175
  • Rockford170–175
  • North ID / NW MT140–145
  • Silver Valley145–150
Regional envelope: 160-235 (full member range)

SW→NE · 6 mph · Light

Limited mixing

Surface High Likelihood of smoke affecting near-ground air during this period. Aloft High Likelihood of elevated smoke overhead; this does not by itself indicate surface AQI impact.

Location AQI forecast

AQI FORECAST — SPOKANE, WA

Last 47.9 Hours (History) • Next 48 Hours (Forecast) • Regulatory monitor composite

Good0-50Moderate51-100Unhealthy forSensitive Groups101-150Unhealthy151-200Very Unhealthy201-300Hazardous301+Sunday, 2:00 PM — Observed AQI: 157 (Unhealthy)Sunday, 3:00 PM — Observed AQI: 168 (Unhealthy)Sunday, 4:00 PM — Observed AQI: 171 (Unhealthy)Sunday, 5:00 PM — Observed AQI: 173 (Unhealthy)Sunday, 6:00 PM — Observed AQI: 178 (Unhealthy)Sunday, 7:00 PM — Observed AQI: 181 (Unhealthy)Sunday, 8:00 PM — Observed AQI: 182 (Unhealthy)Sunday, 9:00 PM — Observed AQI: 188 (Unhealthy)Sunday, 10:00 PM — Observed AQI: 194 (Unhealthy)Sunday, 11:00 PM — Observed AQI: 193 (Unhealthy)Monday, 12:00 AM — Observed AQI: 193 (Unhealthy)Monday, 1:00 AM — Observed AQI: 194 (Unhealthy)Monday, 2:00 AM — Observed AQI: 196 (Unhealthy)Monday, 3:00 AM — Observed AQI: 196 (Unhealthy)Monday, 4:00 AM — Observed AQI: 196 (Unhealthy)Monday, 5:00 AM — Observed AQI: 195 (Unhealthy)Monday, 6:00 AM — Observed AQI: 194 (Unhealthy)Monday, 7:00 AM — Observed AQI: 192 (Unhealthy)Monday, 8:00 AM — Observed AQI: 188 (Unhealthy)Monday, 9:00 AM — Observed AQI: 174 (Unhealthy)Monday, 10:00 AM — Observed AQI: 156 (Unhealthy)Monday, 11:00 AM — Observed AQI: 114 (Unhealthy for Sensitive Groups)Monday, 12:00 PM — Observed AQI: 93 (Moderate)Monday, 1:00 PM — Observed AQI: 134 (Unhealthy for Sensitive Groups)Monday, 2:00 PM — Observed AQI: 158 (Unhealthy)Monday, 3:00 PM — Observed AQI: 159 (Unhealthy)Monday, 4:00 PM — Observed AQI: 159 (Unhealthy)Monday, 5:00 PM — Observed AQI: 162 (Unhealthy)Monday, 6:00 PM — Observed AQI: 168 (Unhealthy)Monday, 7:00 PM — Observed AQI: 174 (Unhealthy)Monday, 8:00 PM — Observed AQI: 180 (Unhealthy)Monday, 9:00 PM — Observed AQI: 183 (Unhealthy)Monday, 10:00 PM — Observed AQI: 184 (Unhealthy)Monday, 11:00 PM — Observed AQI: 185 (Unhealthy)Tuesday, 12:00 AM — Observed AQI: 184 (Unhealthy)Tuesday, 1:00 AM — Observed AQI: 182 (Unhealthy)Tuesday, 2:00 AM — Observed AQI: 181 (Unhealthy)Tuesday, 3:00 AM — Observed AQI: 181 (Unhealthy)Tuesday, 4:00 AM — Observed AQI: 181 (Unhealthy)Tuesday, 5:00 AM — Observed AQI: 181 (Unhealthy)Tuesday, 6:00 AM — Observed AQI: 181 (Unhealthy)Tuesday, 7:00 AM — Observed AQI: 181 (Unhealthy)Tuesday, 8:00 AM — Observed AQI: 181 (Unhealthy)Tuesday, 9:00 AM — Observed AQI: 180 (Unhealthy)Tuesday, 10:00 AM — Observed AQI: 173 (Unhealthy)Tuesday, 11:00 AM — Observed AQI: 169 (Unhealthy)Tuesday, 12:00 PM — Observed AQI: 153 (Unhealthy)Tuesday, 1:53 PM — Forecast median: 153; likely range 153-153 (Unhealthy)Tuesday, 2:00 PM — Forecast median: 153; likely range 152-154 (Unhealthy)Tuesday, 3:00 PM — Forecast median: 166; likely range 158-177 (Unhealthy)Tuesday, 4:00 PM — Forecast median: 187; likely range 175-201 (Unhealthy)Tuesday, 5:00 PM — Forecast median: 226; likely range 195-235 (Very Unhealthy)Tuesday, 6:00 PM — Forecast median: 226; likely range 183-238 (Very Unhealthy)Tuesday, 7:00 PM — Forecast median: 180; likely range 163-219 (Unhealthy)Tuesday, 8:00 PM — Forecast median: 163; likely range 146-226 (Unhealthy)Tuesday, 9:00 PM — Forecast median: 160; likely range 142-180 (Unhealthy)Tuesday, 10:00 PM — Forecast median: 158; likely range 141-177 (Unhealthy)Tuesday, 11:00 PM — Forecast median: 165; likely range 147-187 (Unhealthy)Wednesday, 12:00 AM — Forecast median: 177; likely range 158-195 (Unhealthy)Wednesday, 1:00 AM — Forecast median: 187; likely range 165-205 (Unhealthy)Wednesday, 2:00 AM — Forecast median: 191; likely range 173-210 (Unhealthy)Wednesday, 3:00 AM — Forecast median: 188; likely range 170-207 (Unhealthy)Wednesday, 4:00 AM — Forecast median: 182; likely range 156-201 (Unhealthy)Wednesday, 5:00 AM — Forecast median: 173; likely range 151-191 (Unhealthy)Wednesday, 6:00 AM — Forecast median: 156; likely range 137-182 (Unhealthy)Wednesday, 7:00 AM — Forecast median: 151; likely range 132-173 (Unhealthy)Wednesday, 8:00 AM — Forecast median: 141; likely range 122-160 (Unhealthy for Sensitive Groups)Wednesday, 9:00 AM — Forecast median: 132; likely range 113-151 (Unhealthy for Sensitive Groups)Wednesday, 10:00 AM — Forecast median: 136; likely range 117-155 (Unhealthy for Sensitive Groups)Wednesday, 11:00 AM — Forecast median: 132; likely range 113-151 (Unhealthy for Sensitive Groups)Wednesday, 12:00 PM — Forecast median: 138; likely range 119-157 (Unhealthy for Sensitive Groups)Wednesday, 1:00 PM — Forecast median: 137; likely range 117-156 (Unhealthy for Sensitive Groups)Wednesday, 2:00 PM — Forecast median: 130; likely range 111-150 (Unhealthy for Sensitive Groups)Wednesday, 3:00 PM — Forecast median: 133; likely range 114-153 (Unhealthy for Sensitive Groups)Wednesday, 4:00 PM — Forecast median: 128; likely range 108-154 (Unhealthy for Sensitive Groups)Wednesday, 5:00 PM — Forecast median: 147; likely range 127-167 (Unhealthy for Sensitive Groups)Wednesday, 6:00 PM — Forecast median: 154; likely range 128-174 (Unhealthy)Wednesday, 7:00 PM — Forecast median: 163; likely range 143-183 (Unhealthy)Wednesday, 8:00 PM — Forecast median: 150; likely range 130-171 (Unhealthy for Sensitive Groups)Wednesday, 9:00 PM — Forecast median: 161; likely range 141-181 (Unhealthy)Wednesday, 10:00 PM — Forecast median: 160; likely range 140-181 (Unhealthy)Wednesday, 11:00 PM — Forecast median: 156; likely range 136-177 (Unhealthy)Thursday, 12:00 AM — Forecast median: 146; likely range 125-166 (Unhealthy for Sensitive Groups)Thursday, 1:00 AM — Forecast median: 141; likely range 120-162 (Unhealthy for Sensitive Groups)Thursday, 2:00 AM — Forecast median: 141; likely range 120-162 (Unhealthy for Sensitive Groups)Thursday, 3:00 AM — Forecast median: 143; likely range 122-164 (Unhealthy for Sensitive Groups)Thursday, 4:00 AM — Forecast median: 143; likely range 122-164 (Unhealthy for Sensitive Groups)Thursday, 5:00 AM — Forecast median: 133; likely range 112-155 (Unhealthy for Sensitive Groups)Thursday, 6:00 AM — Forecast median: 126; likely range 105-148 (Unhealthy for Sensitive Groups)Thursday, 7:00 AM — Forecast median: 118; likely range 97-139 (Unhealthy for Sensitive Groups)Thursday, 8:00 AM — Forecast median: 119; likely range 97-140 (Unhealthy for Sensitive Groups)Thursday, 9:00 AM — Forecast median: 116; likely range 94-137 (Unhealthy for Sensitive Groups)Thursday, 10:00 AM — Forecast median: 126; likely range 104-147 (Unhealthy for Sensitive Groups)Thursday, 11:00 AM — Forecast median: 133; likely range 112-155 (Unhealthy for Sensitive Groups)ISSUED1:53 PMMon12 AMMon12 PMTue12 AMTue12 PMWed12 AMWed12 PMThu12 AMThu12 PM
Observed historyForecast medianForecast range

Smoke movement

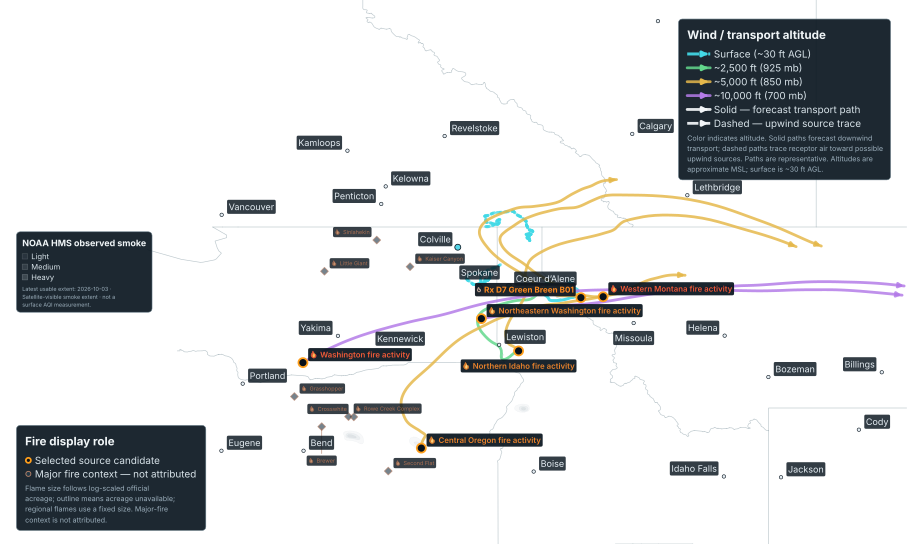
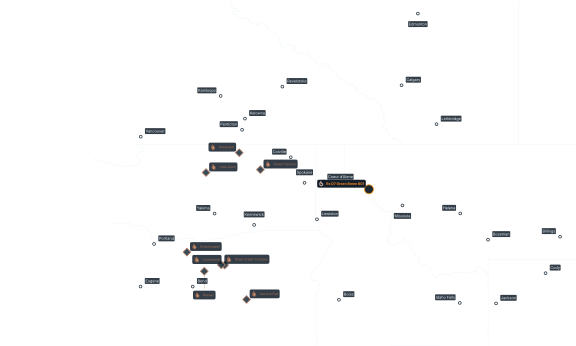
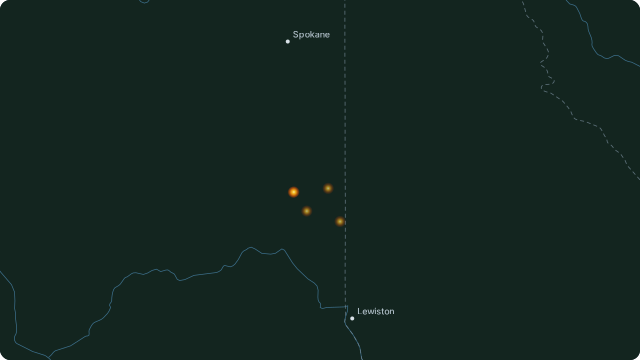
Dominant W flow transports air toward E during midday. The leading ordinal source candidates are Southern British Columbia fire activity, Northern Idaho fire activity, Northeastern Washington fire activity.
REGIONAL SOURCES AND TRANSPORT

Source potential

Ranked source potential, not estimated percentage contribution.

RankSource PotentialEvidence
1 High Regional aggregate High ordinal potential from 2 unresolved source clusters in this region.
2 High Regional aggregate High ordinal potential from 1 unresolved source cluster in this region.
3 High Regional aggregate High ordinal potential from 1 unresolved source cluster in this region.
4 Medium Verified Very Active · report 17h old — Operational report notes torching and wind driven fire.
5 Medium Verified Moderate · report 19h old — Operational report notes torching.

Forecast confidence

81% · Medium confidence
  • Satellite analysis detected visible smoke over or near the region.
  • Surface smoke signal is high.
  • Elevated smoke signal is high.
  • Community sensors show a northeast to southwest gradient.
  • All essential forecast components are rated medium or higher, so overall confidence is medium.

About this forecast

This forecast combines fire detections, official incident intelligence, weather and smoke-transport models, satellite-visible smoke, and surface observations to estimate smoke conditions.

Methodology and limitations
  • Ordinal source potential — not percentage contribution
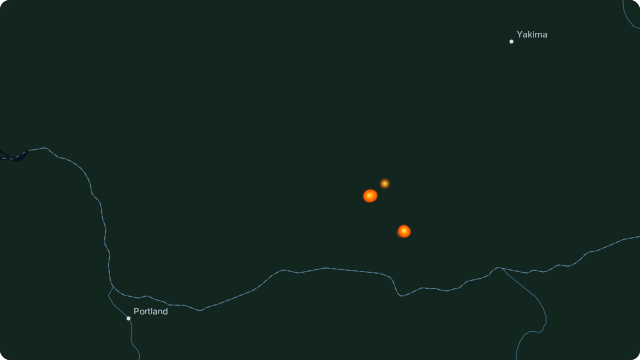
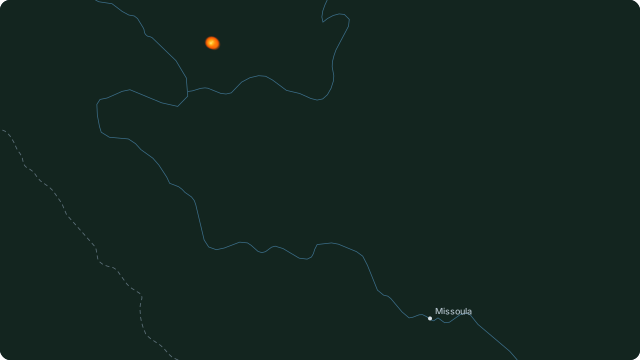
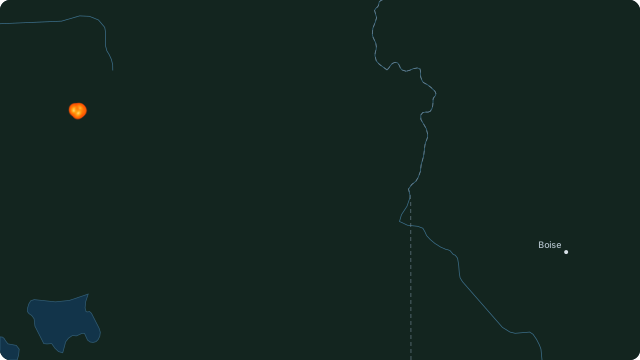
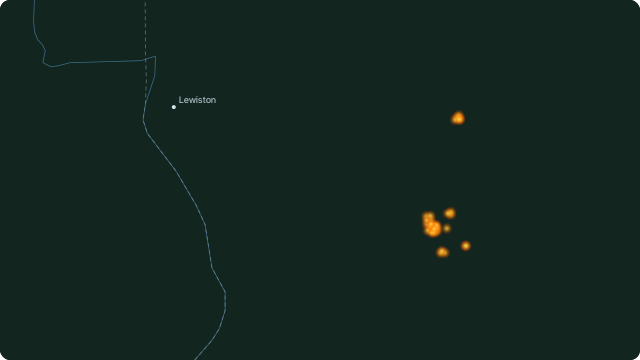
  • FIRMS detections are thermal anomalies, not fire perimeters.
  • Trajectory lines are model wind paths, not smoke plumes.
  • HRRR-Smoke is model output, not observed PM2.5 or AQI.
  • No direct conversion from HRRR-Smoke concentration to AQI is applied.
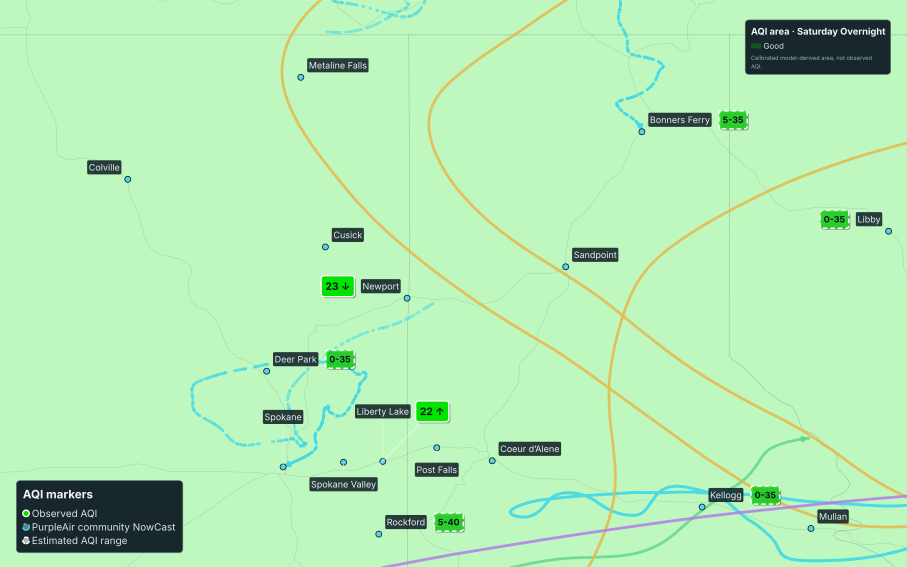
  • The local AQI area is a calibrated model-derived heuristic, not observed AQI.
  • NOAA HMS polygons show satellite-visible column smoke, not surface PM2.5 or AQI.